- Home
- / Services
- / Metallography & Failure Analysis
Metallography & Failure Analysis
Systematic microstructural characterisation and root cause failure analysis — from precision sample preparation and optical metallography through SEM fractography, EDS elemental mapping, and EBSD crystallography. We don’t just describe the fracture; we trace it to its origin.
Section 1 — Sample Preparation
Precision Preparation. No Artefacts. No Compromises.
Metallographic interpretation is only as reliable as the specimen preparation. Every step — sectioning, mounting, grinding, polishing — is performed by trained metallographers following ASTM E3 protocols. Preparation-induced artefacts are systematically eliminated before any microstructural assessment begins.
Sample Preparation Workflow
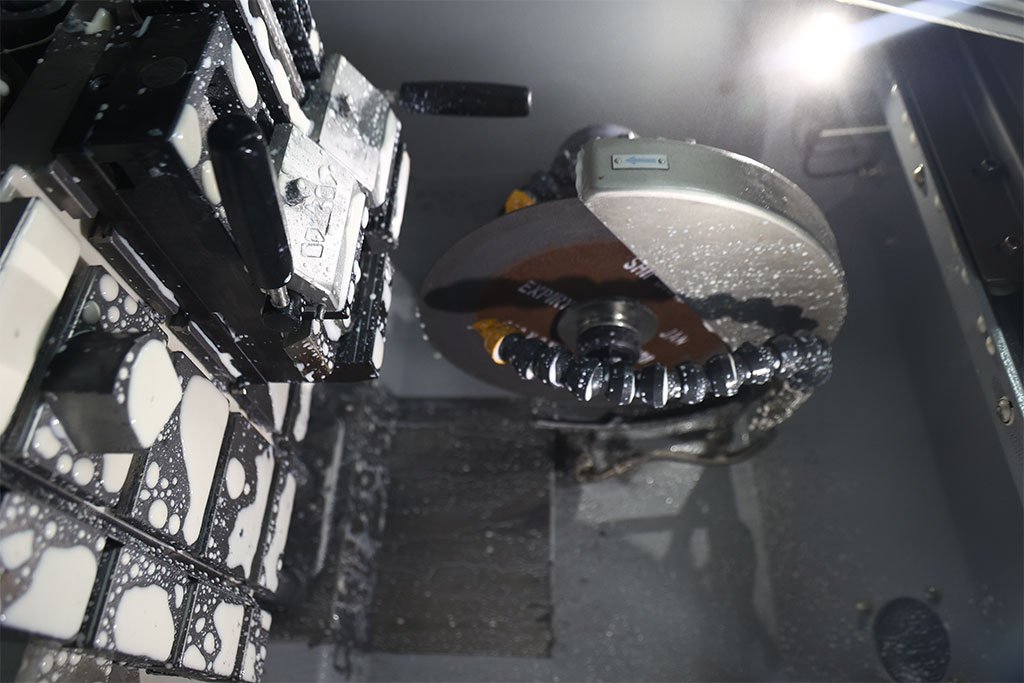
Sectioning
Abrasive cut-off wheel or precision low-speed saw. Location and orientation documented per ASTM E3.
Mounting
Hot compression mounting (Bakelite, Phenolic) or cold mounting (epoxy, acrylic) for delicate or heat-sensitive specimens.
Planar Grinding
SiC abrasive papers: 120, 240, 400, 600, 800, 1200, 2400, 4000 grit. Progressive through each grade under controlled pressure.
Diamond Polishing
Diamond suspensions: 9 µm, 3 µm, 1 µm on polishing cloths. Scratch-free mirror finish.
OPS / Final Polish
Colloidal silica (0.04 µm) for final chemo-mechanical polish — critical for EBSD specimen preparation.
Etching
Reagent selected by alloy system. Immersion or swab etch. Time-controlled to prevent over-etching.
Hot Mounting
Compression Mounting — Bakelite & Phenolic Resins
Preferred for routine metallographic examination. Applied under heat (150–180°C) and pressure (200–300 bar) for 5–8 minutes. Produces hard, dimensionless mounts with good edge retention. Bakelite for general-purpose; Phenolic (black) for harder materials. Not suitable for specimens sensitive to heat, such as polymer-coated or low-melting materials.
Cold Mounting
Epoxy & Acrylic Systems — Ambient Cure
Epoxy resins used for maximum edge retention, corrosion-sensitive surfaces, porous specimens, and SEM/EBSD work requiring non-conductive or conductive (carbon-loaded) formulations. Acrylic (Castable) resins for rapid cure when turn-around is critical. Vacuum-assisted infiltration available for porous or interconnected defect networks.
| Stage | Medium | Grit / Grade | Purpose | Duration (Typical) |
|---|---|---|---|---|
| Planar Grinding | SiC abrasive paper | 120 → 240 → 400 → 600 | Remove sectioning damage; establish flat plane | 2–5 min per step |
| Fine Grinding | SiC abrasive paper | 800 → 1200 → 2400 → 4000 | Progressive scratch removal; edge retention | 2–4 min per step |
| Diamond Polishing — Coarse | Diamond suspension on cloth | 9 µm | Remove fine grinding scratches; high metal removal | 5–8 min |
| Diamond Polishing — Medium | Diamond suspension on cloth | 3 µm | Refine surface; approach mirror finish | 4–6 min |
| Diamond Polishing — Fine | Diamond suspension on cloth | 1 µm | Mirror finish; all scratches removed | 3–5 min |
| Final Polish (OPS) | Colloidal silica suspension | 0.04 µm | Chemo-mechanical polish; stress-free surface; EBSD-ready | 5–15 min |
Specimen sectioning uses our in-house precision abrasive cut-off machines. No outsourcing. Mounted samples are labelled, photographed, and traceable throughout the preparation-to-examination chain.
Section 2 — Etching Reagents
Reagent Selection by Alloy System and Objective.
View all etching reagents by alloy system
| Reagent | Composition | Alloy / Application | Features Revealed | Notes |
|---|---|---|---|---|
| Nital | 2–4% HNO₃ in ethanol | Carbon & low alloy steels, cast irons | Grain boundaries, ferrite/pearlite/martensite/bainite distinction, prior austenite grain boundaries (high Nital concentration) | Most widely used steel etchant; time-sensitive |
| Picral | 4% picric acid in ethanol | Carbon & low alloy steels | Pearlite colony boundaries and interlamellar spacing; prior austenite grain boundaries; cementite in carbide networks | Does not attack ferrite; preferred for carbide distribution |
| Vilella's | 1g picric acid + 5 mL HCl + 100 mL ethanol | Stainless steels (martensitic, PH grades), tool steels, high-speed steel | Prior austenite grain boundaries, martensite morphology, delta ferrite, carbide distribution in tool steel | Particularly effective for 410, 420, 440, 17-4 PH |
| Kalling's No. 2 | 5g CuCl₂ + 100 mL HCl + 100 mL ethanol | Austenitic & duplex stainless steel, nickel alloys | Grain structure, phase balance (austenite/ferrite ratio), sigma phase, carbide precipitation at grain boundaries | Standard for 304, 316, 2205 duplex; distinguishes phases by colour contrast |
| Oxalic Acid (Electrolytic) | 10% oxalic acid in water, 6V DC | Austenitic stainless steels | Intergranular corrosion susceptibility screening (sensitisation); carbide precipitation along grain boundaries | ASTM A262 Practice A screening etch; rapid, non-destructive indicator |
| Murakami's | 10g K₃Fe(CN)₆ + 10g KOH + 100 mL water | Tool steels, carbide-bearing alloys, Mo-containing alloys | Carbide types (M₆C, M₂₃C₆, MC), sigma phase in stainless steels and superalloys, grain boundary phases | Hot (60–80°C) or cold application; temperature governs selectivity |
| Beraha's | Sodium thiosulphate-based tint etchant (various formulations) | Stainless steels, duplex SS, cast irons, non-ferrous | Phase contrast by tint colour — ferrite vs austenite in duplex SS; graphite morphology in cast iron | Film-forming tint etchant; colour contrast without polarised light |
| Keller's | 2.5 mL HNO₃ + 1.5 mL HF + 1 mL HCl + 95 mL water | Aluminium alloys | Grain structure, intermetallic particles, second-phase precipitates, weld fusion line in Al alloys | Standard for all wrought and cast aluminium alloys |
| Swab / Immersion HF | 1–2% HF in water | Titanium alloys | Alpha/beta phase morphology, prior beta grain boundaries, transformed beta structures in Ti-6Al-4V | Short etch times; longer etch for prior beta grain boundary revelation |
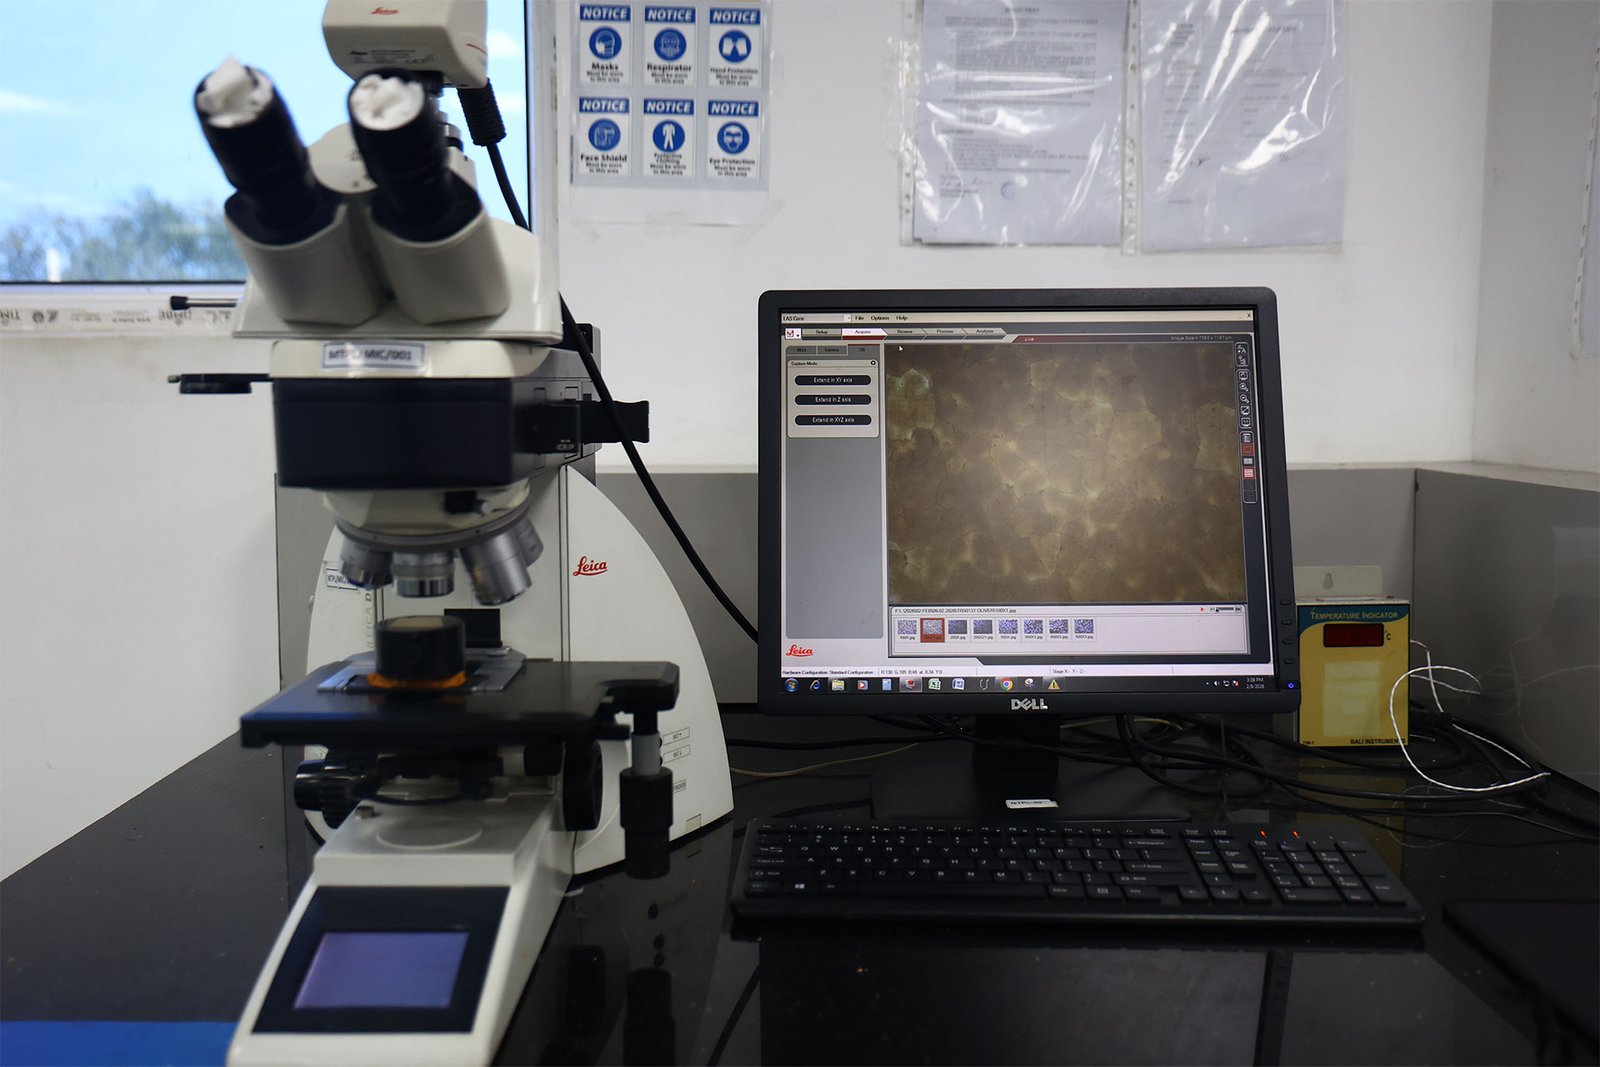
Section 3 — Microstructural Examination
Quantitative Microstructure. Accredited Parameters. Interpreted Results.
Microstructural characterisation goes beyond visual description. Each parameter is measured against a defined standard, reported with quantitative ratings, and interpreted in the context of the material specification and application requirement.
| Examination Type | What Is Measured | Method / Standard | Reported Output |
|---|---|---|---|
| Grain Size Determination | Average grain size of single-phase metals; prior austenite grain size in heat-treated steels; austenite grain size in stainless steel | ASTM E112, ISO 643, IS 4163 | ASTM grain size number (G); equivalent circle diameter; micrograph at stated magnification |
| Inclusion Rating | Non-metallic inclusions: sulphides (Type A), aluminas (Type B), silicates (Type C), globular oxides (Type D); worst-field and average ratings | ASTM E45 (Methods A, C, D), ISO 4967, IS 7739 | Inclusion type, thin/heavy series ratings; chart comparisons; worst field and average values |
| Phase Identification & Volume Fraction | Phase balance in duplex/super-duplex SS; retained austenite in case-hardened steels; delta ferrite in SS welds; sigma/intermetallic phase detection | ASTM E562 (point counting), ASTM A800 (Ferritscope), image analysis | Phase volume fraction (%); spatial distribution; ferrite number (FN) for welds |
| Decarburisation Depth | Total decarburisation depth and free ferrite decarburisation depth in carbon and low alloy steels; surface carbon loss in spring steels, bearing steels, fasteners | ASTM E1077, IS 15916 | Total decarburisation depth (mm); free ferrite depth (mm); micrograph at stated magnification |
| Case Depth (Effective / Total) | Case depth in carburised, nitrided, carbonitrided, and induction-hardened components; hardness gradient from surface to core | ASTM E92, E384 (Vickers traverses) | Effective case depth at defined hardness criterion; total case depth; hardness traverse plot |
| Coating Thickness (Metallographic) | Cross-sectional thickness of metallic coatings (Zn, Ni, Cr, hard chrome, electroless Ni), diffusion layers, and conversion coatings | ASTM B487, IS 1573 | Coating thickness (µm) at multiple measurement points; interface condition assessment |
| Microstructure Characterisation | Phase morphology and distribution (ferrite, pearlite, bainite, martensite, Widmanstätten ferrite, acicular ferrite); graphite morphology in cast irons; precipitation and segregation | ASTM E7, various IS standards | Descriptive microstructure report with calibrated micrographs at ×50, ×100, ×200, ×500 or as required |
| Carburised Layer Assessment | Case structure uniformity, carbide network continuity, retained austenite distribution in case layer | Microhardness traverse + metallographic examination | Case uniformity; carbide morphology; retained austenite estimate |
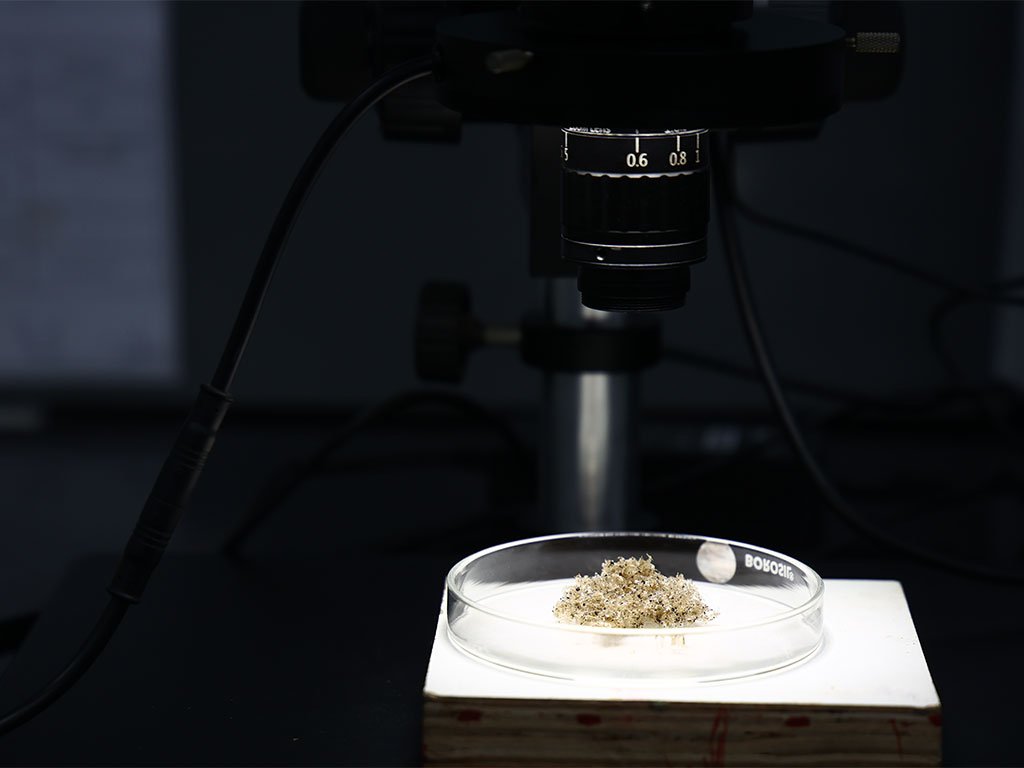
Section 4 — Macro Examination
Weld Macros. Sulphur Prints. Ingot Segregation. Fracture Surfaces.
Macroscopic examination reveals large-scale structural features — weld bead geometry, segregation patterns, flow lines in forgings, and the broad morphology of fracture surfaces — that cannot be assessed at microscopic magnification.
Weld Macros
Cross-Section Examination of Welds
Macrographic cross-sections prepared and etched (typically 10% ammonium persulphate for steels or 50% HCl hot etch) to reveal bead geometry, penetration depth, fusion zone width, heat-affected zone (HAZ) extent, bead-on-bead deposition sequence, incomplete fusion, cracks, porosity, and undercut. Essential for weld procedure qualification (PQR) per ASME IX, AWS D1.1, and EN ISO 15614.
Sulphur Prints (Baumann Test)
Sulphide Distribution in Steel Sections
Photographic imprint of sulphide distribution in a steel cross-section. Sulphur segregation maps — ingot, billet, plate, and forging cross-sections — reveal centre segregation, banding severity, and macro-segregation patterns. Performed per ASTM E1180 using dilute sulphuric acid on photographic paper pressed against the polished steel surface.
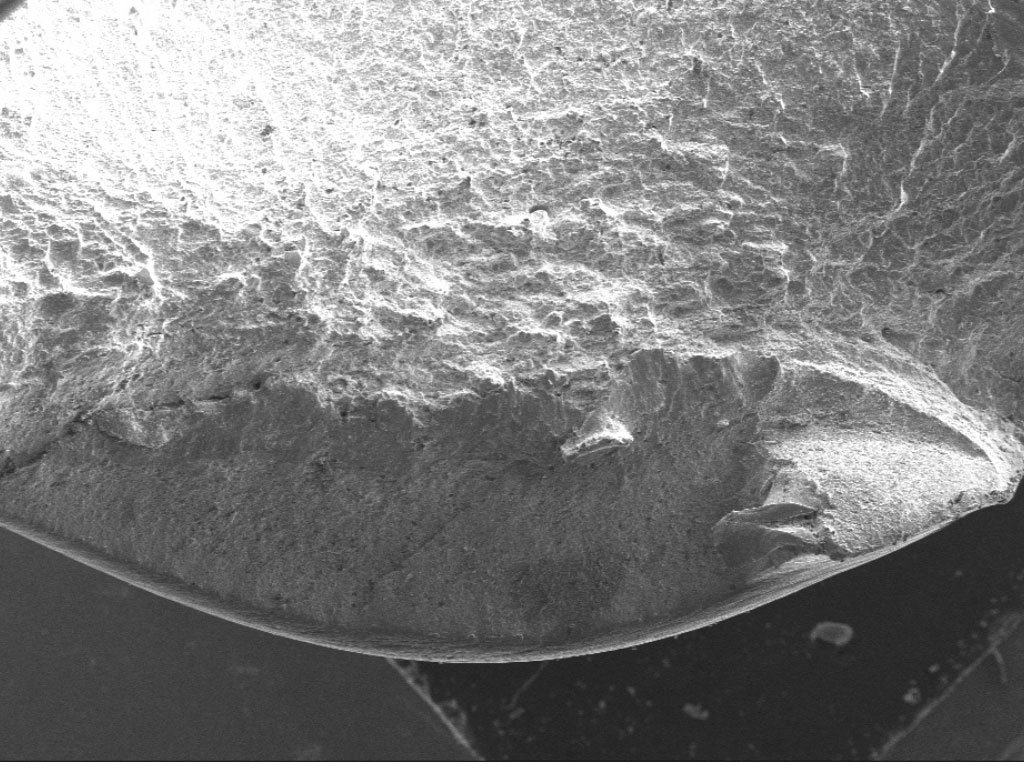
Fracture Surface Macro
Visual and Low-Magnification Fractography
Initial macro examination of fracture surfaces documents overall fracture plane orientation, fracture origin location, beach marks (fatigue), chevron patterns (brittle fracture), shear lip presence, and percent shear area. Low-magnification stereo microscopy (up to ×50) bridges visual assessment and SEM fractography.
Ingot & Forging Quality
ASTM E381 — Steel Macro Rating
Macro rating of steels for central porosity, segregation, ingot pattern, and structural discontinuities. Transverse sections of bars, billets, and blooms are etched with hot acid and rated against ASTM E381 reference charts. Used for incoming inspection of bar stock, shaft forgings, and pressure vessel blanks.
Flow Line Analysis
Forging Grain Flow Examination
Macro-etch of forged and wrought components to reveal grain flow (fibre flow lines). Confirms that grain flow follows the contour of the forging — essential for connecting rods, crankshafts, aircraft structural forgings, and pressure-containing components where directional grain flow is a design requirement.
Section 5 — Hardness Profiling & Mapping
Case Depth by Hardness Traverse. Weld Hardness Mapping. Micro-Vickers to 0.01 kgf.
| Hardness Technique | Load Range | Application | Standards |
|---|---|---|---|
| Micro-Vickers (HV) | HV 0.01 to HV 1 (10 gf to 1 kgf) | Case depth traverses (carburised, nitrided, induction-hardened), thin sections, coating layers, individual phases, weld HAZ mapping | ASTM E384, ISO 6507-1 |
| Vickers (HV) | HV 1 to HV 100 (1 kgf to 100 kgf) | Weld hardness surveys (cap/mid/root), HAZ traverses, cross-weld profiles per BS EN ISO 9015, through-thickness profiles | ASTM E92, ISO 6507-1, BS EN ISO 9015-1/2 |
| Effective Case Depth | Micro-Vickers traverse | Effective case depth defined at HV550 (carburised), HV500 (induction), or client-specified criterion; total case depth to core hardness level | ASTM E1058, DIN 50190, ISO 2639 |
| Weld Hardness Mapping | HV5 or HV10 | Grid of indentations across weld metal, HAZ, and base metal — reveals hardness gradient, local hard spots, hydrogen damage risk assessment | BS EN ISO 9015-1/2, NACE MR0175 / ISO 15156 hardness limits |
| Jominy End-Quench Hardenability | HRC traverse | Hardenability curve for alloy steels; confirms heat lot conformance to SAE / ASTM hardenability band | ASTM A255, SAE J406 |
Hardness map reporting: All microhardness traverses are reported as tabulated values and plotted hardness profile charts with location co-ordinates referenced to the specimen cross-section diagram. Calibration is traceable to national reference standards. Indentation spacing conforms to ASTM E384 minimum requirements to prevent work-hardening interference.
Section 6 — Failure Analysis Methodology
Systematic RCFA. Multi-Disciplinary. Root Cause — Not Just Description.
Background Collection & Specimen Receipt
Document service history, operating conditions, load cycles, environment, material specification, and previous maintenance history. Photograph all submitted parts undisturbed before any cleaning or sectioning.
Visual Examination
Fracture Surface Analysis (Fractography)
SEM fractography at high magnification to identify failure mode: fatigue striations, dimple rupture, cleavage facets, intergranular vs transgranular crack path, beach marks, radial marks, secondary cracking, and oxide layers on crack surfaces.
Metallographic Sectioning
Cross-sections through the failure origin and representative sound locations. Microstructure, heat treatment condition, defects (laps, seams, voids, inclusions), grain boundary condition, prior processing damage, and comparison with specification.
Chemical Analysis & Material Verification
OES or ICP composition verification against the material standard. Detection of wrong-material substitution, dilution in weld metal, contamination, and coating chemistry. EDS for localised elemental characterisation at the failure site.
Mechanical Testing
Hardness traverses across the failure zone, tensile testing from unaffected material if sufficient stock is available, and impact testing to assess notch toughness relative to the operating temperature.
Advanced Characterisation (SEM / EDS / EBSD)
EDS elemental mapping at the fracture origin for corrosion deposits, pit chemistry, and crack-tip precipitates. EBSD for local misorientation (GND density, KAM), grain boundary character (CSL boundaries), and texture-driven cracking anisotropy.
Root Cause Determination & Report
Integration of all findings into a root cause conclusion with contributing factors ranked by significance. Recommendations for corrective action: material change, process modification, design revision, maintenance interval revision, or specification update.
Common Failure Modes We Investigate
- Fatigue fracture — HCF/LCF, fretting fatigue, corrosion fatigue, thermal fatigue
- Overload / ductile fracture — tensile overload, torsional fracture, shear lip
- Brittle fracture — cleavage, low-temperature embrittlement, temper embrittlement, hydrogen embrittlement
- Stress corrosion cracking (SCC) — chloride SCC, caustic SCC, polythionic acid SCC
- Hydrogen damage — hydrogen embrittlement, hydrogen-induced cracking (HIC), SSCC
- Corrosion-assisted cracking — pitting-initiated fatigue, crevice corrosion, galvanic attack
- Sensitisation — intergranular attack, carbide precipitation at grain boundaries in SS
- Creep & high-temperature damage — creep cavitation, oxide wedging, thermal fatigue cracking
- Weld defects — lack of fusion, hot cracking, cold cracking, underbead HAZ cracks, liquation cracking
- Manufacturing defects — forging laps/seams, decarburisation, quench cracking, grinding burns
Section 7 — Fracture Modes & Identification
Every Fracture Has a Fingerprint. We Read It.
View all 8 fracture modes and identification markers
Mode — Ductile
Dimple Rupture (Microvoid Coalescence)
Multi-disciplinary RCFA: FE-SEM fractography, metallography, chemical verification, NDE (Micro-CT, XRD, eddy current, borescope). Grain size (ASTM E112), inclusion rating (E45), decarburisation depth (E1077), case depth (E92), ferrite measurement by Ferritscope (ASTM A800), duplex SS phase volume fraction (ASTM E562), Jominy end-quench hardenability (ASTM A255).
- Equiaxed Dimples
- Shear Dimples
- Inclusion Nucleation
Mode — Brittle
Cleavage Fracture
Flat, faceted fracture following specific crystallographic planes (e.g., {100} in BCC steels). River patterns converge on crack origin. Chevron markings at lower magnification. Occurs in BCC metals below DBTT, at high strain rates, or with notch stress concentration. No prior plastic deformation at origin.
- River Marks
- Chevron Pattern
- BCC / Below DBTT
Mode — Fatigue
Fatigue Striations
Parallel striations perpendicular to local crack propagation direction — each striation represents one load cycle. Spacing proportional to stress intensity range (ΔK). Beach marks at lower magnification from load-spectrum or environment changes. Origin often at surface stress concentration or inclusion.
- Striations
- Beach Marks
- Ratchet Marks
Mode — Intergranular
Intergranular Fracture
Crack propagates along grain boundaries rather than through grains. Faceted "rock candy" appearance showing grain boundary facets. Occurs in temper embrittlement, hydrogen embrittlement, stress corrosion cracking, high-temperature oxidation/liquation, or sensitised stainless steels. EBSD confirms grain boundary character (CSL fraction).
- Rock Candy
- H-Embrittlement
- SCC / Sensitisation
Mode — Hydrogen
Hydrogen Embrittlement & HIC
Intergranular or mixed IG/TG morphology in hydrogen-charged high-strength steels. Secondary cracking parallel to primary fracture. Discontinuous crack growth steps. HIC in pipeline steels shows stepwise cracking in the mid-thickness segregation zone. EDS confirms absence of corrosion products; hydrogen is not EDS-detectable but context is diagnostic.
- Intergranular
- Secondary Cracks
- NACE TM0284
Mode — SCC
Stress Corrosion Cracking
Branched crack morphology; IG or TG depending on alloy/environment combination. Crack faces show corrosion products (chlorides for austenitic SS, sulphides for sour service). Low ductility despite adequate material toughness. EDS confirms corrosive species at crack tip. Often co-occurs with pitting as initiation sites.
- Branched Cracks
- Corrosion Products
- EDS Identification
Mode — Creep
Creep Cavitation & Wedge Cracking
Creep cavities (r-type) nucleate at grain boundary triple points or second-phase particles under sustained stress at elevated temperature. Link to form intergranular wedge cracks (w-type) at higher stresses. Oxidation and grain boundary voiding observed metallographically. Common in boiler tubes, steam pipelines, turbine blades.
- r-Type Cavities
- w-Type Cracks
- High Temperature
Mode — Temper Embrittlement
Temper / Thermal Embrittlement
Intergranular fracture resulting from segregation of impurities (P, Sn, Sb, As) to prior austenite grain boundaries during service or heat treatment in the embrittlement range (350–570°C). Auger electron spectroscopy (AES) or EBSD grain boundary chemistry analysis confirms. Common in heavy rotor steels, pressure vessel steels.
- IG Fracture
- P/Sn/Sb/As Segregation
- 350–570°C Range
Section 8 — Advanced Characterisation
SEM. EDS. EBSD. Sub-Micron Characterisation of Failure Sites.
Multi-channel servo-hydraulic endurance test beds for automotive component
durability, suspension fatigue, and structural validation.
FE-SEM Fractography
FIELD EMISSION SCANNING ELECTRON MICROSCOPY
- Fatigue striation spacing measurement (crack growth rate estimation)
- Dimple size and morphology analysis (fracture mode confirmation)
- Cleavage facet orientation and river mark tracing
- Secondary crack morphology and branching pattern
- Corrosion product morphology and distribution
- Inclusion characterisation at fracture origin
EDS Elemental Mapping
ENERGY-DISPERSIVE X-RAY SPECTROSCOPY
- Point analysis at crack origin — corrosive species identification
- Elemental maps — chlorine, sulphur, oxygen at fracture surfaces
- Grain boundary segregation profiling (P, S, Cr depletion)
- Coating layer composition and diffusion zone mapping
- Phase identification support — EDS combined with BSE contrast
- Inclusion chemistry — MnS, Al₂O₃, TiN, complex oxides
EBSD Analysis
ELECTRON BACKSCATTER DIFFRACTION
- Inverse pole figure (IPF) maps — texture and grain orientation
- Grain boundary character — CSL boundaries, twin fraction, Σ3 frequency
- KAM / GND density — local strain concentration at crack tips
- Phase identification — austenite/martensite/ferrite fractions
- Retained austenite quantification (complementary to XRD)
- Deformation texture in forming failures and fatigue
Our dedicated FE-SEM / EDS / EBSD page details instrument specifications, specimen preparation requirements for EBSD, representative case studies, and the full scope of crystallographic services available.
Full SEM / EBSD Details →
Section 9 — Standards & Codes
ASTM. ISO. IS. AWS. ASME. All Major Metallographic Standards.
View complete standards reference list
| Standard | Title / Scope | Parameter Covered |
|---|---|---|
| ASTM E3 | Guide for Preparation of Metallographic Specimens | Specimen preparation — sectioning, mounting, grinding, polishing |
| ASTM E7 | Terminology Relating to Metallography | Reference standard for all metallographic terminology |
| ASTM E45 | Determining the Inclusion Content of Steel | Inclusion rating — Type A, B, C, D; Methods A, C, D |
| ASTM E112 | Determining Average Grain Size | Grain size number (G), planimetric method, comparison method |
| ASTM E340 | Macroetching Metals and Alloys | Macro-etch techniques, reagent selection, reporting |
| ASTM E381 | Method of Macroetch Testing Steel Bars, Billets, Blooms and Forgings | Macro rating — porosity, segregation, structural discontinuities |
| ASTM E1077 | Estimating the Depth of Decarburization of Steel Specimens | Total and free ferrite decarburisation depth |
| ASTM E562 | Determining Volume Fraction by Systematic Manual Point Count | Phase volume fraction — duplex SS, retained austenite |
| ASTM E384 | Microindentation Hardness of Materials | Micro-Vickers and Knoop hardness; case depth traverses |
| ASTM E92 | Vickers Hardness and Knoop Hardness of Metallic Materials | Vickers hardness; weld traverses; case depth |
| ASTM A800 | Steel Casting, Austenitic Alloy — Delta Ferrite Content | Delta ferrite content in austenitic SS castings and welds |
| ASTM A255 | Determining Hardenability of Steel | Jominy end-quench hardenability curve |
| ASTM E1180 | Preparing Sulfur Prints for Macrostructural Examination | Sulphur print (Baumann test) procedure |
| ISO 643 | Steels — Micrographic Determination of the Apparent Grain Size | Grain size determination — ISO method |
| ISO 4967 | Steel — Determination of Content of Non-Metallic Inclusions | Inclusion rating — ISO micrographic method |
| IS 4163 | Methods of Microscopical Examination of Grain Size | Grain size — Indian Standard method |
| IS 7739 | Methods for Assessment of Cleanliness in Steels by Microscopic Method | Inclusion rating — Indian Standard method |
| AWS D1.1 | Structural Welding Code — Steel | Weld macro acceptance criteria; macro examination requirements |
| ASME Section IX | Welding, Brazing and Fusing Qualifications | Macro examination for PQR and WPQ |
| BS EN ISO 9015-1/2 | Destructive Tests on Welds in Metallic Materials — Hardness Testing | Weld hardness survey — Vickers traverse requirements |
Related Services
Failure Analysis Is Never Standalone
A complete failure investigation draws on corrosion testing, mechanical characterisation, chemical analysis, and advanced fractography. All are available in-house.
FE-SEM / EDS / EBSD
Thermo Fisher + Zeiss + COXEM FE-SEMs. nm-resolution fractography, EDS elemental mapping, EBSD orientation mapping, phase identification — the investigative tools that close failure cases.
- Fractography
- EBSD
- EDS Mapping
Corrosion Testing
When failure analysis identifies a corrosion mechanism, corrosion testing quantifies susceptibility. SSCC, HIC, IGC, SCC, pitting, electrochemical — full NACE / ASTM suite.
- NACE TM0177
- ASTM A262
- G48
Fatigue, Fracture & Creep
Fatigue failure identified in the field? Quantify remaining life with KIC, da/dN, and CTOD testing. Creep damage characterised metallographically can be correlated to creep rupture data.
- ASTM E399
- E647
- E1820
Weld Qualification
Weld failures are investigated through macro/micro examination, hardness surveys, and EDS at the fusion zone. PQR and WPQ macro examination are standard outputs from our metallography laboratory.
- ASME IX
- AWS D1.1
- API 1104
Examination Workflow
From sample receipt to engineer-authored report
| Step | Process | Details |
|---|---|---|
| 1 | Sample Receipt & Logging | Unique ID assigned, condition documented (photography), chain-of-custody initiated for failure analysis specimens |
| 2 | Sectioning | Abrasive cutting with coolant to prevent thermal damage. Location selected based on failure zone, weld HAZ, or specification requirements |
| 3 | Mounting | Hot compression (Bakelite/phenolic) or cold mounting (epoxy) depending on specimen sensitivity. Edge retention mounting for coatings and case-hardened layers |
| 4 | Grinding & Polishing | Progressive SiC papers (120–2500 grit), diamond paste (6–1 μm), final colloidal silica (0.05 μm) for EBSD-ready surfaces |
| 5 | Etching | Chemical etchants selected per alloy system: Nital (carbon steel), Vilella's/Kalling's (stainless), Keller's (aluminium), oxalic acid (IGC screening) |
| 6 | Optical Microscopy | Bright-field, dark-field, polarised light, DIC. Magnification 50×–1000×. Image analysis for grain size, inclusion rating, phase fraction, porosity |
| 7 | SEM / EDS / EBSD | Escalation for sub-micron features, elemental identification, fracture surface analysis, or crystallographic mapping. Separate report section if requested |
| 8 | Interpretation & Report | Engineer-authored narrative: observations, standard compliance, anomaly identification, comparison with specification, conclusions, and recommendations |
Failure Class → Investigation Pathway
Fracture / Cracking
Broken component or visible cracks
Visual examination → SEM fractography (origin, propagation, final fracture) → Cross-section metallography (microstructure, defects) → EDS if contamination suspected → Mechanical testing of adjacent material if needed.
Corrosion / Pitting / Perforation
Wall loss, pitting, discolouration
Visual + stereo microscopy → Cross-section metallography (pit morphology, attack depth) → SEM/EDS (corrosion product composition) → Chemistry verification (material grade confirmation) → IGC screening if intergranular suspected.
Wear / Surface Damage
Galling, erosion, abrasion, scoring
Surface profilometry → Cross-section metallography (deformation zone, subsurface damage) → Hardness profiling → SEM imaging of wear features → EDS for transfer material identification.
Weld Defects
Cracking, porosity, lack of fusion, undercut
Macro-examination (cross-section, etch, geometry) → Micro-examination (HAZ, fusion line, weld metal microstructure) → Hardness survey across weld → SEM if cracking mechanism needs characterisation.
Heat Treatment Issues
Unexpected hardness, distortion, soft spots
Hardness survey → Microstructure comparison (actual vs. expected) → Decarburisation/carburisation depth measurement → Grain-size analysis → Chemistry to confirm grade before blaming heat treatment.
Material Mix-Up / Grade Dispute
Suspected wrong material
Chemistry (OES/ICP) for grade identification → Microstructure comparison with specification → Hardness confirmation → Mechanical testing if contractual properties are in dispute.
Evidence Handling & Chain of Custody
Sample Intake Protocol
Photographic documentation at receipt, tamper-evident packaging, unique tracking ID, condition assessment before any preparation begins. All observations logged with timestamps.
Non-Destructive First
Visual, photographic, and non-destructive examination completed before any cutting or preparation. Fracture surfaces imaged by SEM before cross-sectioning. Preserves maximum evidential value.
Retained Material
Untested portions of failure specimens retained for 90 days (or as agreed) for independent re-examination. Sample disposal only after written client authorisation.
2–3 Days
Standard Turnaround
1–2 Days
Express Available
ISO 17025:2017
Reporting structure
Related Services
FE-SEM / EDS / EBSD
Nanometre-resolution imaging, elemental mapping, and crystallographic analysis
Metals Testing
Mechanical, chemical, and metallographic testing of ferrous and non-ferrous metals
Corrosion Testing
SSCC, HIC, IGC, salt spray, pitting, and electrochemical corrosion evaluation
Weld Qualification
PQR and WPQ testing per ASME IX, AWS D1.1, EN ISO 15614, and API 1104